


At CLOUDETEER GmbH, we're managing services for multiple hyperscalers, Microsoft 365 (M365), and Kubernetes.
Our monitoring system is built on Prometheus, so we needed a way to integrate M365 metrics and alarms. As a provider of M365 Managed Services, it is essential for us to monitor various services within the M365 ecosystem, such as Intune and license usage, to ensure optimal performance and compliance. However, Microsoft has no usable tool.
Our M365 Monitoring Challenge
Many third-party solutions rely heavily on PowerShell scripting. While PowerShell is a mighty tool, there is no clean way to integrate it. Another possible approach, relying on manual checks, is simply not proactive enough for the dynamic nature of cloud services like M365. Furthermore, we strive to keep costs low for our customers and avoid relying on expensive solutions like Datadog.
So we chose to build our own little Prometheus exporter and open source it. As this has now been running for several months in production, we would like to share our experience with you.
Go, OpenMetrics, and Azure SDK: Building the Exporter's Foundation
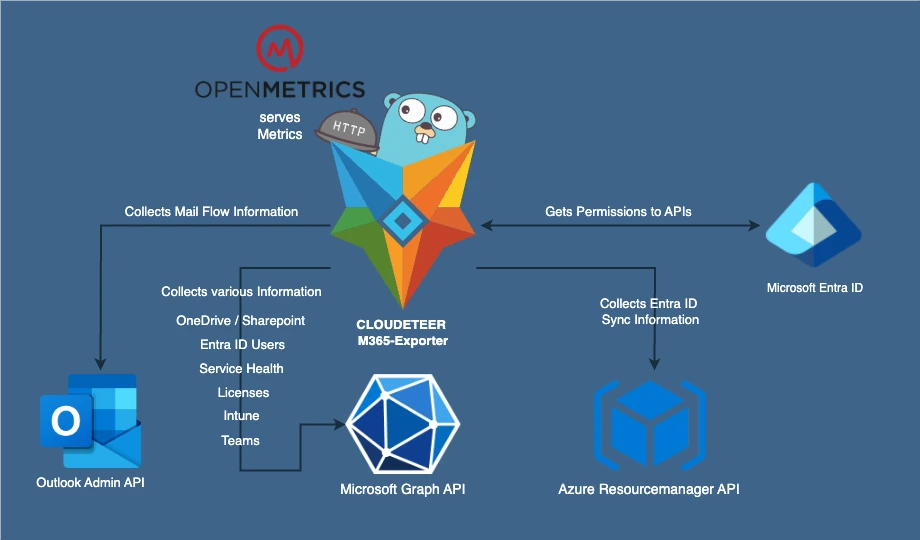
The obvious choice for the language is Golang, as it is widely used in the Kubernetes/Prometheus ecosystem. Besides existing knowledge in this field, we also wanted to build more expertise. Golang also provides an SDK that can be used to publish metrics in the openMetrics format, which makes it possible for Prometheus to read it. Using the Azure SDK for authentication makes it behave like any other Azure tool (Terraform Provider, Azure CLI), which is super convenient during development, usage and deployment. This enables the exporter to run alongside our monitoring stack on Azure Kubernetes Service with workload identity, allowing for passwordless authentication against Azure, thus eliminating any hassle with expiring secrets and their management.
Unleashing the Power of the Microsoft Graph API
The next question to be answered is: Where are we going to get our data from? To find an answer to this, we went into Hands-on sessions with our M365 consultants. They were able to show us the integrated insights, and some drilling into this revealed the glorious and untapped data heap, which is the Graph API. Corresponding to this, the Go Graph SDK seemed proficient and is now a core part of our exporter. Furthermore, with Microsoft’s ambition to migrate more and more services to the Graph API, we felt encouraged in our design choice. Although the design may be sound, the API has its quirks, which we had to work around.
Why did the developer break up with Microsoft APIs?
Because every time they asked for a response, it took forever, was poorly formatted, and sometimes never showed up at all! 🚀🐌💩
Graph API: The Good, the Bad, and the Asynchronous
Prometheus relies on quick responses from an exporter, so our only option was to go with an asynchronous design, which made the architecture more complex. One additional requirement is that data has to be collected at different time intervals to avoid hitting rate limits. There is a lot more to consider, such as presenting Graph data in a meaningful way for Prometheus' TSDB, which is too much for this article. So we might create another post going into more detail about the exporter’s architecture.
While this project enables us to integrate lots of M365 data into our toolchain, there are still limits to this approach: As mentioned above, Microsoft is moving data to the Graph API, but this process is not entirely finished. There are still some blind spots that we encountered, such as the Sharepoint Storage Capacity. Others are hidden behind some obscure PowerShell SDKs like M365 Compliance Score. Another topic is that Graph API requests and their responses are vastly different from one another. This prohibits us from writing a generic exporter, which “simply” translates Graph to Prometheus, meaning every additional feature or dataset requires manual development labor.
M365 Monitoring: We Built It, We Open-Sourced It, You Can Use It!
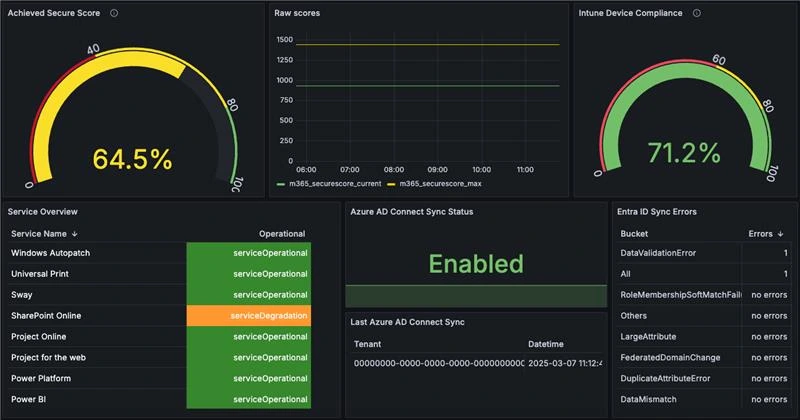
In the end, we were able to create seven collectors, feeding data from dozens of M365 datasets into our monitoring platform and operations toolchain. This enables exhaustive alerting and reporting on our service delivery and enhances our transparency towards operations personnel and the customer.
At this point, you might ask, “Why are you open-sourcing it then?” Our entire monitoring stack is solely based on open source software, and the exporter was the only “closed source” component. So for us, it was an obvious step to release it to the public. Maybe it is good for our Karma, but we also hope to receive some input on the tool, some contributions and constructive critique. We think that we were able to provide some useful state to start with: It is a working piece of software and we even tried to provide some useful documentation. We’d love to hear your feedback—try it out, explore the documentation, and let us know how we can improve it!
Direct GitHub Link: https://github.com/cloudeteer/m365-exporter